airport
Salt Lake City Airport Statistics: Traffic, Busiest Months & Airlines
SLC handled 28.16 million passenger movements in 2025. Through July 2026, traffic was running 2.0% ahead of the same period last year. Here are the numbers behind those trends.
Key findings
- 2025 passenger traffic was 0.7% below 2024. Annual comparison.
- Traffic was 27.2% higher in 2025 than in 2015, and 5.0% above 2019. Historical benchmarks.
- January–July 2026 added 329,909 passenger movements compared with those months in 2025. Year-to-date comparison.
- July had the highest monthly total in 2025; June had the highest daily average. Monthly table.
- Delta and SkyWest’s Delta Connection operation accounted for 70.2% of 2025 enplanements. Airline share and grouping.
These are our calculations from the Salt Lake City Department of Airports reports linked below. Latest period checked: July 2026. The annual archive linked to a July summary when we checked on September 12, even though the monthly report list ended in June. This page does not estimate the unreported months.
How has SLC passenger traffic changed?
SLC recorded 28,158,007 total passengers in 2025, compared with 28,364,610 in 2024. The difference was 206,603 fewer passenger movements.
| Calendar year | Total passenger movements | Primary source, page 1 |
|---|---|---|
| 2015 | 22,141,026 | 2015 summary |
| 2019 | 26,808,014 | 2019 summary |
| 2024 | 28,364,610 | 2024 summary |
| 2025 | 28,158,007 | 2025 summary |
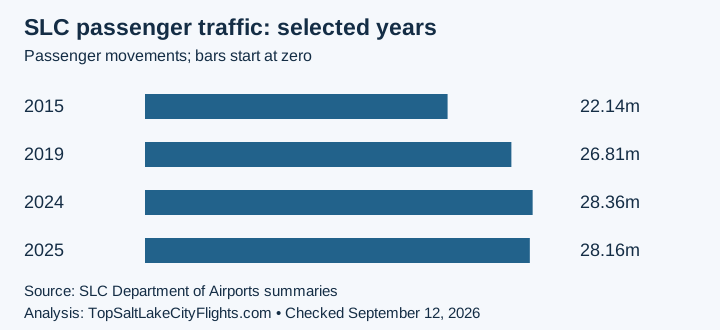
Selected benchmark years, not a continuous annual series. Chart and percentage comparisons: TopSaltLakeCityFlights.com analysis of the linked official summaries.
We use 2015 as a ten-year comparison and 2019 as the pre-pandemic benchmark. The small decline from 2024 does not erase the longer-term increase. These totals alone cannot tell us why demand changed, how much airlines earned, or whether a particular route gained passengers.
How many passengers has SLC handled in 2026?
SLC handled 16,897,407 passenger movements from January through July 2026, versus 16,567,498 over the same seven months in 2025, an increase of 2.0%.
The 2026 total comprises 8,351,518 enplanements and 8,545,889 deplanements. Sources: 2026 summary through July, page 1 and 2025 summary, page 1. The 2025 comparison is our sum of January through July.
July 2026 alone recorded 2,615,549 passenger movements. A partial-year total is not a full-year forecast: we do not multiply it up to predict December’s result.
What was SLC’s busiest month?
July was the busiest month by total passenger movements in 2025, at 2,588,668. It was 10.3% above the average monthly total for that year. November had the lowest total, at 2,052,283.
Adjusting for month length changes the leader: June averaged 84,148 passenger movements per day, just above July’s 83,505. These are arithmetic averages, not observed counts for each day.
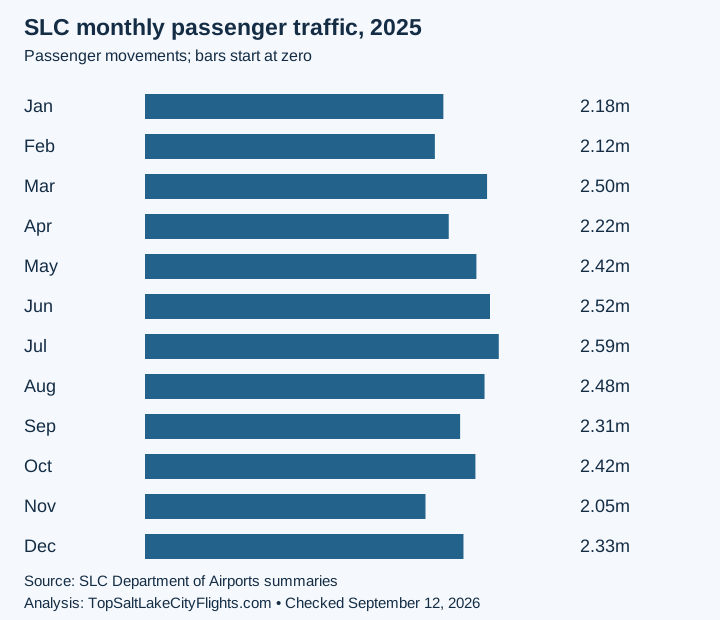
| Month | 2025 total | 2025 daily average | 2026 total |
|---|---|---|---|
| January | 2,183,127 | 70,423 | 2,193,481 |
| February | 2,120,944 | 75,748 | 2,162,281 |
| March | 2,503,033 | 80,743 | 2,523,522 |
| April | 2,222,457 | 74,082 | 2,339,251 |
| May | 2,424,843 | 78,221 | 2,480,374 |
| June | 2,524,426 | 84,148 | 2,582,949 |
| July | 2,588,668 | 83,505 | 2,615,549 |
| August | 2,484,435 | 80,143 | Not reported |
| September | 2,305,852 | 76,862 | Not reported |
| October | 2,417,669 | 77,989 | Not reported |
| November | 2,052,283 | 68,409 | Not reported |
| December | 2,330,270 | 75,170 | Not reported |
Sources: 2025 summary, page 1 and 2026 summary through July, page 1. Daily averages are our calculations, rounded to whole passenger movements. “Not reported” means outside this dataset’s coverage, not zero traffic.
Does a quieter month mean shorter security lines?
No. Airport-wide monthly volume cannot predict a specific checkpoint wait, departure bank or holiday rush. A relatively quiet month can still contain very busy individual days.
Use our SLC Busy Days Calendar for dated events that may affect your trip. For a connection, use the terminal connection-time guide. Historical statistics should not be used to shorten your airport-arrival buffer.
What share of SLC passengers fly Delta?
Delta plus SkyWest’s Delta Connection operation carried 70.2% of SLC’s departing passenger movements in 2025. This is a share of enplanements, not flights, seats, revenue or unique travelers.
| Airline group | 2025 enplanements | Share of all enplanements |
|---|---|---|
| Delta + SkyWest Delta Connection | 9,785,096 | 70.2% |
| Southwest | 1,444,549 | 10.4% |
| United + listed regional operators | 827,954 | 5.9% |
| American + listed regional operators | 753,418 | 5.4% |
| All other operators / charters | 1,129,147 | 8.1% |
| Total | 13,940,164 | 100.0% |
Source: 2025 summary, page 2, Enplaned table. Group totals and shares are our calculations. Percentages may not add to exactly 100% because of rounding.
Delta’s group adds its 8,035,488 enplanements to 1,749,608 for SkyWest (Delta Connection). United includes the report’s United, Mesa and United Express (SkyWest) rows. American includes American, Envoy and SkyWest (American). We group only the regional rows explicitly associated with those airlines in the report. “All other” is the remaining enplanements, including charters.
This historical table is not a list of airlines or routes currently operating. For destination planning, see the SLC nonstop destinations tool.
What do these passenger numbers actually count?
“Total passengers” combines people boarding and leaving aircraft at SLC. It does not count distinct individuals. Someone who arrives and later departs can appear in both counts, and repeat trips add more movements.
- Enplanements: boarding movements at SLC.
- Deplanements: movements off arriving aircraft at SLC.
- Total passengers: enplanements plus deplanements, including domestic and international traffic.
- Airline share here: an airline group’s enplanements divided by all enplanements for the same year.
Do not describe these totals as Utah tourists, unique airport visitors or people going through TSA screening. Connecting traffic is included, and a passenger connecting inside the secure terminal does not necessarily pass through a checkpoint at SLC.
How did SLC rank for passenger satisfaction in 2026?
SLC tied for seventh among large North American airports, according to Axios’ report on J.D. Power’s 2026 results.
J.D. Power’s study used 24,710 completed surveys across the study—not just SLC—from July 2025 through July 2026. Its large-airport category covers 10–32.9 million annual passengers. This is a passenger-experience survey, not a measured security-wait or on-time-performance ranking.
For travel planning, use your actual gates and the SLC terminal walking and connection guide. A satisfaction rank does not establish how long your own connection or security screening will take. This survey result is separate from the airport traffic dataset below.
Download the data and check our method
Download the source-linked dataset (JSON). The readable tables above contain the monthly totals and selected annual benchmarks; the download also includes the operator inputs behind our airline calculations.
Our calculations use:
- Percentage change: (new-period total ÷ comparison-period total − 1) × 100.
- Year-to-date comparison: sum January through July in each year. No comparison of seven months with twelve.
- Daily average: monthly passenger total ÷ calendar days in that month.
- Monthly comparison with the annual mean: month total ÷ (annual total ÷ 12) − 1.
- Airline share: grouped enplanements ÷ 13,940,164 × 100 for 2025.
We retain exact source counts and round only displayed calculations. We checked that the twelve 2025 monthly totals sum to the published annual total, and that the seven 2026 monthly totals sum to the published July year-to-date total.
Source limitation: the 2025 report’s international annual subtotals differ between pages 1 and 2. We have not used those subtotals to publish an international share. The all-passenger totals and enplanement denominator used here reconcile. Airport reports can be revised; the source-check date is not the end date of the data.
How to cite this page
For a raw count, cite the Salt Lake City Department of Airports report and its reporting period. For our charts, groupings or comparisons, cite TopSaltLakeCityFlights.com, “Salt Lake City Airport Statistics,” updated September 23, 2026, alongside the underlying airport report. The traffic dataset was checked September 12; the satisfaction section was added September 23.
Please preserve the reporting period and metric when quoting a figure. In particular, label the current-year result “January–July 2026,” and the airline percentages “2025 enplanement share.”
Sources checked
Primary sources checked September 12, 2026. Schedules, prices, and operating rules can change; follow the linked source for the latest information.
- J.D. Power 2026 airport satisfaction study (checked September 23, 2026)
- Axios: SLC's 2026 satisfaction rank (checked September 23, 2026)
- SLC Department of Airports: air traffic statistics archive
- SLC: 2025 summary (pages 1–2)
- SLC: 2026 summary through July (page 1)
- SLC: 2024 summary (page 1)
- SLC: 2019 summary (page 1)
- SLC: 2015 summary (page 1)
Related guides
SLC Airport Connection Times: How Long You NeedAllow about 45 minutes for an easy domestic connection, 60 minutes when changing concourses, and 90–120 minutes after an international arrival.
SLC Airport Pickup & Drop-Off: Where to GoAgree on the level before you drive to the curb. SLC separates passenger pickup, departures, and the indoor greeting area, so a quick text can save a second trip around the terminal.
SLC Airport to Downtown Salt Lake City: Train, Taxi & UberFor a downtown stay near a TRAX stop, start with the Green Line. Choose a taxi or rideshare for door-to-door convenience, heavy luggage or an arrival after train service ends.
Stay connected
Keep these SLC guides easy to find
If this guide helped, add Top Salt Lake City Flights as a preferred source. Google may then highlight our guides for you in AI Overviews, AI Mode, and Top Stories.